Background
Measuring risk has been a long time practice in risk management, as is probably one of the primary tools used as part of the practice. The idea behind it was to move away from the less usable “high/medium/low†metrics employed in the early days of quantifying (or more accurately – qualifying) risk, into a more measurable, repeatable and comparable metric system. One that would enable comparing two risk scenarios and realizing which one yields more risk, and allow us to track the effectiveness of mitigating controls and changes in the scenario as far as risk mitigation goes.
In the advent of social media, and its omnipresence across mediums and endpoints, there is an increased need to apply a form of risk metrics to a person’s social media presence, and as a derivative, an organization’s social media presence (i.e. it’s employees, it’s own “brand†presence, as well as it’s 3rd parties, and any other organizational affiliation social media activity).
The Social Media Risk Metrics Framework is designed to fill such gap, by providing a defensible, measurable, and adaptable solution for tracking said risk. The approach leans heavily on risk metric frameworks such as FAIR and OCTAVE, and is designed to complement those.
Goals
When creating the social media risk metric framework, a few goals have been set as follows:
- Provide a measurable way to quantify the risk associated with online activity of the organization and its employees.
- Provide another measure for quantifying the risk of working with 3rd parties and contractors.
- Create a score for executives to measure their social media exposure (from an executive protection perspective, insider trading, etc…)
- Create a score for measuring and comparing intra- and extra-industry social media risk ratings
- Be able to quantify the effect of changing controls, processes and policies on the risk associated with social media.
Setting organizational priorities
The framework takes into account several organizational axioms and understanding that each organization would have a different set of sensitivities or priorities as far as risk tolerance, allows weighting such biases as part of the metrics framework. These priorities reflect three main elements of the framework: threat types, vulnerabilities, and influence types.
The metrics framework
The workflow of the framework goes through 3 phases: setting priorities, monitoring social media parameters, and measuring/calculating risk.
Setting Priorities
As mentioned prior, each organization has its own set of priorities for acceptable risk exposure, and the framework is designed to allow each organization to weight those appropriately. Each of the categories contains several granular elements that require weighting, and is allotted with a fixed number of points to distribute between them. The suggested point allotment can be easily customized to allow more/less granular weighing, as long as the final weighing sums up to 1, or 100%.
The Threat types category is allotted with 50 points to distribute between:
- Fraud
- Espionage
- Error
- Hacktivism – political
- Hacktivism – economic
- Hacktivism – religious
- Hacktivism – sports
The Vulnerability category is allotted 20 points to be distributed between:
- Technology
- IP
- Physical
- Social
And the Influence category is also allotted with 50 points to be distributed between:
- Financial
- Stock
- PR
- Technology
- Intellectual Property
- Competitive
- Other individuals in org
- Market Share
It is expected that each organization would have different sets of sensitivities based on their operating environment, culture, geography, and risk appetite. As such, the user of the framework dictates the biases in scoring risk rather than having a rigid scale that is hard to defend on a per-case basis.
Tracking social elements
Once the weights have been set for the organization, a basic set of monitoring elements have to be tracked and measured in order to be fed later on into the risk metric calculation. The monitored elements at this point include:
- The impersonators ratio – the ratio between the peer group size in the organization (i.e. if the profile to be measured is an executive, then the peer group is the size of the executive team), and the number of impersonators that the measured identity has (i.e. non-sanctioned profiles that are not operated by the actual person whom we are measuring risk for).
- The number of followers of the impersonating profiles.
- The number of followers of the impersonation profiles who are also friends/connected with the real profile.
- The number of followers of the impersonation profiles who are also friends/connected with the organization (either to an organizational account, or to another person associated with the organization).
- The number of fun/parody accounts (if exist) out of the impersonating ones (in order to make a biased distinction between a potentially less harmful impersonation such as a fun/parody one, and one that attempts to impersonate the identity, or serve as a placeholder for future use).
Risk calculation
The last phase of using the framework is basically “checking†each of the “leaves†of the measurement risk calculation tree to reflect whether it applies/exists for the measured identity. This phase will also account for the priorities/biases provided in phase 1, as well as factor in the measurements taken in phase 2, and will produce four (4) base risk factors: Likelihood, Manifestation, Impact, and a Factored instances of online threats. These factors are to be used when expressing the quantified risk of an identity (as well as for an organization, or a 3rd party – whichever is used), and will reflect changes in the exposure and controls related to the identity in question.
The scalable elements (likelihood, manifestation, and impact) are graded out of a normalized scale of 0-10, while the factored instances of online threats provide a numeral representation of the potential instances/occurrences of threat scenarios on social media that are associated with the tracked identity in question.
These measures should already be factored and biased for the organization in question, hence can be compared against other individual’s risk metric/score in the organization, in the industry and even across industries, as the factoring/biasing are designed to “level†the playing field and express an environmental risk based on one’s exposure.
Tracked parameters
Organization Size
This is the number of full-time employees and contractors that are directly associated with the organization, and are under the influence of the organizational management span (as far as policies, and processes go).
The tracked parameters element associated with organization size, is the number of employees for which online activity is being monitored to identify threats/risks through this framework.
Organization Management
This represents the number of employees in influential management positions (usually C-level, and upper management).
The tracked parameters element associated with organization management, is the number of executives for which online activity is monitored in order to identify threats/risks through this framework.
Locations
The number of geographical locations in which the organization has a physical presence at.
Non-executive chatter
The total number of interactions online that are associated with non-executive employees which are tracked for the organization. This number is designed to provide a baseline for the volume of interactions for which the risk scoring is factored.
The number of interactions are counted on a rolling 6-months window.
Executive-chatter
The total number of interactions online that the are associated with executive employees (as represented by the “organization management†parameter) which are tracked for the organization. This number is designed to provide a baseline for the volume of interactions for which the risk scoring is factored for executives, and the scale against the non-executive chatter.
The number of interactions are counted on a rolling 6-months window.
Executive impersonations
The number of executive impersonations that have been identified for monitored employees.
This count reflects the currently active impersonating profiles.
Non-executive impersonations
The number of non-executive impersonations that have been identified for monitored employees.
This count reflects the currently active impersonating profiles.
Parameters for the Risk Metrics Formula Section
For parameters that are calculated in the formula section of the risk metrics framework, a qualitative approach has been taken, which means that every measured parameter has a value of either “yes†or “no†in terms of whether the behavior exists or not. When a behavior that falls into one of these tracked parameters exists in the online activity of the person/organization, the value of the associated parameter (and its parent if it is a sub-category) is changed to “1â€.
Likelihood Calculated Parameters
What is the question that we are trying to answer?: Does their online activity increase Likelihood?
Section: How might they motivate threats?
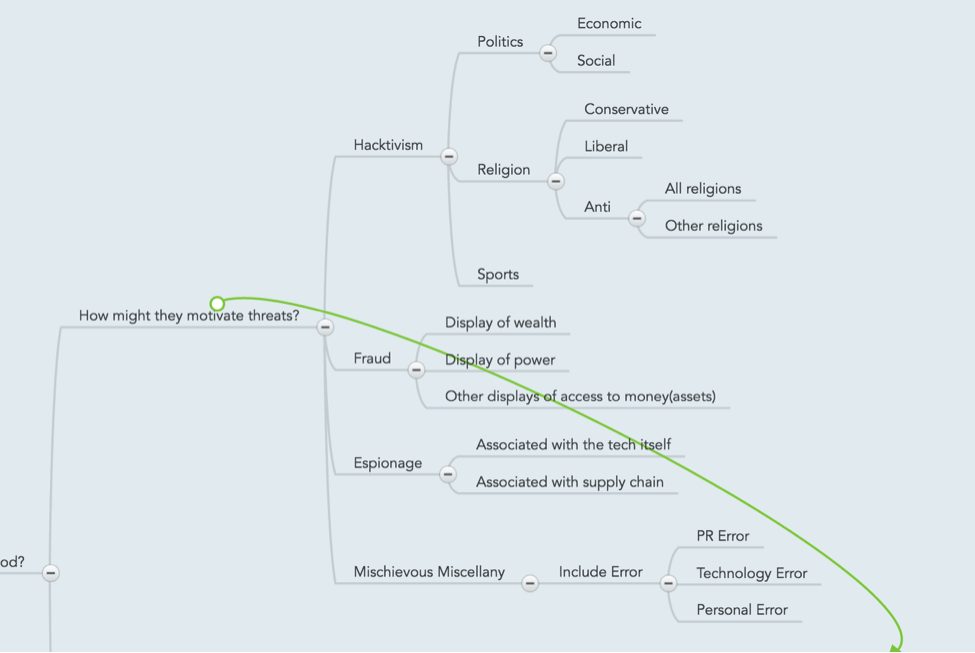
Hacktivism
Hacktivism is tracked based on a subsection of hacktivism categories: Political, Religious, and Sports.
Politics
Political hacktivism is identified based on several categories: economic, social, and religious (which is then broken down further).
Economic
Economic hacktivism manifests itself in the form of activities targeting the economic aspect of an individual or an organization. Examples are Occupy Wall Street, attacks on individuals such as Martin Shkreli, etc…
Social
Social hacktivism manifests itself in the form of activities targeting the social behavior/policies aspect of an individual or an organization. Examples are activities surrounding event such as “black lives matterâ€, police brutality, welfare, and healthcare.
Religion
Religious hacktivism is broken down further into the main religious lines (conservative, and liberal), and into an “Anti†approach – either towards a specific religion, or against all religions. Examples of such hacktivism can be seen in activities that target Muslims, the Church of Scientology, Westboro Baptist (for conservative, and anti-specific religions). Others can be seen in activities surrounding activities such as government policies that are tied to religion (placing an effigy associated with a religion in a government building), activities surrounding pro-life vs. pro-choice (although these can also be categorized as social too).
- Conservative
- Liberal
- Anti
- All religions
- Other religions
Sports
Sports hacktivism is associated with activities revolving around a particular sport, or a team. Examples usually manifest in activities targeting a sports team and its fans.
Fraud
Fraud is tracked based on activities that would entice a potential attacker to target an individual or an organization because of their power or wealth. Online activities that involve the display of either, count against this factor – each in their own sub-category.
Examples of such instances would be bragging about the amount of money than a person/organization makes (posting pictures of lavish lifestyle). Displays of power would be instances where a person/organization shows how the rules don’t apply to them, nepotism, hiring practices, or other judgment that may be conceived as non-rational and driven by the person/organization’s power.
- Display of wealth
- Display of power
- Other displays of access to money(assets)
Espionage
Espionage is tracked based on instances where an individual is associated with sensitive technology, or with the supply chain of an organization, whereas attackers would be able to infiltrate and spy on it.
Associated with the tech itself
A person with access to sensitive technologies (phones, IT, access controls, etc…) and said association can be tracked online, would have this category flagged for them.
Associated with supply chain
A person with access to the supply chain for an organization (decision-making concerning vendor selection, ability to change/interact with suppliers), and said association can be tracked online, would have this category flagged for them.
Mischievous Miscellany
This category tracks miscellaneous mischievous activities and is broken down into sub-sections based on the specific context of said activity.
PR Error
This category represents activities associated with PR errors such as announcements that are miss-scheduled, leaked marketing information, etc.
Technology Error
This category represents errors that are associated with technology, such as misconfiguration of devices, the association of technologies with the organization, leaking geospatial data, etc…
Personal Error
This category covers personal errors that are less likely to be associated with the organization, yet can potentially attract attackers to the employee in question. Examples could be associated with personal faith, divulging personal details (family, friends, residence, future employment), etc…
Manifestation Calculated Parameters
What is the question that we are trying to answer?: How might those threats express themselves?
The parameters tracked here are designed to gauge how a person/organization’s online activity contributes to a specific manifestation of a threat.
Hacking (are they susceptible to common patterns?)
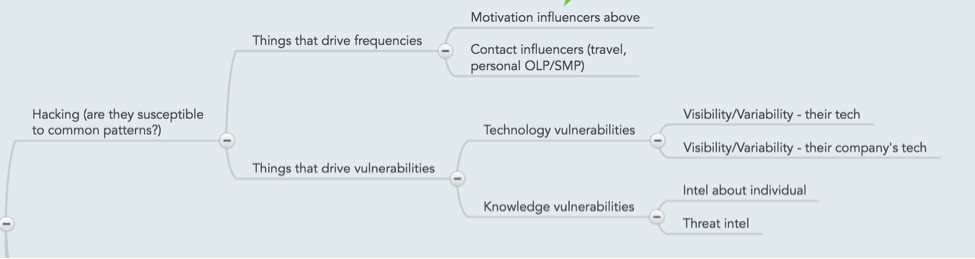
Things that drive frequencies
Motivation influencers above
This parameter is a calculated one and is not user-influenced directly. It is a reflection of calculations for the likelihood section (expressed here as motivation).
Contact influencers (travel, personal OLP/SMP)
This parameter indicates whether the a person’s online activity increases the frequency of engaging with them. Examples that will trigger this parameter range from enticing interactions online (whether openly, or through direct channels), or in person (“Who’s up for drinks at XXX tonight?â€, “Looking forward to spending time with our customers in YYY next weekâ€, etc…).
Things that drive vulnerabilities
Technology vulnerabilities
These parameters (own, and company’s technology) indicate whether the online activity of a person would indicate of using said technology. These reflect data that emanates from an individual’s or an organization’s online presence. Examples are leaking make and version information for devices, association with technology registration (domain names for example), etc…
Visibility/Variability – their tech
Visibility/Variability – their company’s tech
Knowledge vulnerabilities
These parameters (intelligence about an individual, and general threat intelligence) reflect the presence of an external body of knowledge on a person and/or organization that would increase the attack surface (or vulnerability) of said asset. Examples would be external data leaks that allow attackers to manipulate an individual, or an intelligence brief that covers sensitive details about an organization/individual.
- Intel about individual
- Threat Intel
Social
Indicates whether a threat would or have manifested through a social channel (mostly social engineering)
Malware/Crimeware
Indicates whether a threat would or have manifested through malware or crimeware.
Physical
Indicates whether a threat would or have manifested through physical means (threat to person/equipment/facility).
Error
Indicates whether a threat would or have manifested through error (mostly technical errors).
Misuse – internal worth pursuing
Indicates whether a threat would or have manifested through misuse of information or process internal to the organization.
Impact Calculated Parameters
When calculating impact, two main elements are considered here: the type of influence, and the level of influence. Each is then broken down further to identify the specific types of influence and their levels in order to contribute to the final score. The parameters here should reflect a combination of both the online activity of the asset, as well as the actual asset’s access to organizational assets. Therefore, a DBA would have a different scoring here than a CFO (i.e. technical vs. financial).
What is the question that we are trying to answer?: Does their online activity increase Impact?
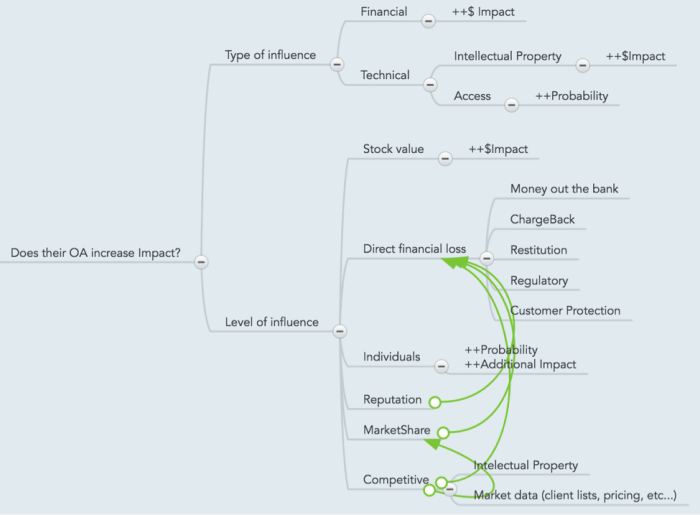
Type of influence
The two types of influence that an asset may have on an organization are financial and technical. An indication on whether the asset possesses the ability to impact a certain category will trigger flagging said element in the formula (which is then calculated based on the biases put into the model to begin with).
Financial
Technical
Note that technical impact is split to “raw†access, and intellectual property (for example, access to source code and design documents, vs. credentials to a system).
- Intellectual Property
- Access
Level of influence
When factoring in the level of influence (vs. simply the type of it), indicators whether an asset can have a substantial impact on a certain category trigger that category’s bias to be included in the final risk score. The sections are fairly self-explanatory.
Stock value
Direct financial loss
-
  Money out the bank
- Â Â ChargeBack
- Â Â Restitution
- Â Â Regulatory
- Â Â Customer Protection
Individuals
Reputation
MarketShare
Competitive
- Â Â Intellectual Property
- Â Â Market data (client lists, pricing, etc…)
Impact Factor Calculated Parameters
In this last section, we are factoring in the external online presence of an asset – mainly what other people are saying about it, and how fraudulent instances of it may increase the risk of said asset.
What is the question that we are trying to answer?: Do they have unsanctioned presence online?
Unsanctioned online presence
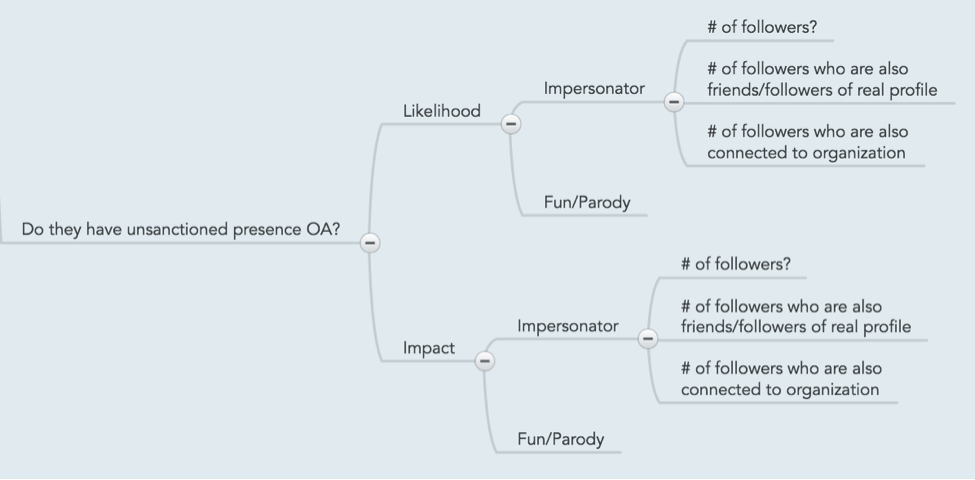
Likelihood
When looking at the likelihood parameter, we are essentially counting the number of instances (or whether they exist or not) of impersonators and fun/parody accounts for a given asset. Factoring in the extent, or reach, of these unsanctioned accounts, is also accounted for here through the count of followers, and their connection to the asset and organization.
Impersonator
  # of followers?
  # of followers who are also friends/followers of real profile
  # of followers who are also connected to organization
Fun/Parody
Impact
A separate branch is the impact calculation, although the same numbers that have been tracked previously (as in impersonator/parody presence, and their extent) are used here, albeit with a different effect on the risk calculation.
Impersonator
  # of followers?
  # of followers who are also friends/followers of real profile
  # of followers who are also connected to organization
Fun/Parody
What kind of non-self-published information is out there on them?
This section of the impact factors reflects non-social media specific publications on the assessed asset. Again – there is a semantic separation between likelihood and impact, but the parameters are the same and just have a different factoring to the risk calculation. Examples for triggering these would be instances of direct mentions of the asset in question on major news publications, on blogs, or generally on social media (but without any direct mapping between the publishing entity and the asset or the organization).
Likelihood
  Major media article
  Independent blog
  On social media
Impact
  Major media article
  Independent blog
  On social media
Future work
Additional work on the framework focuses on refining the risk metrics for an organization vs. an individual (and by association, for 3rd parties as well), as well as factoring in additional tracked elements such as sentiment in content associated with tracked identities, locality information (when tracking an organization with multiple physical presence locations), and measuring malicious content instances that tracked identities are exposed to (while factoring in the degree of exposure as far as “distance†from the social media identity).